
The numbers nobody shows you.
Official crime statistics are public.
And they live on a portal nobody ever opens.
Here they are on a map: how much happens, how it's trending, up or down.
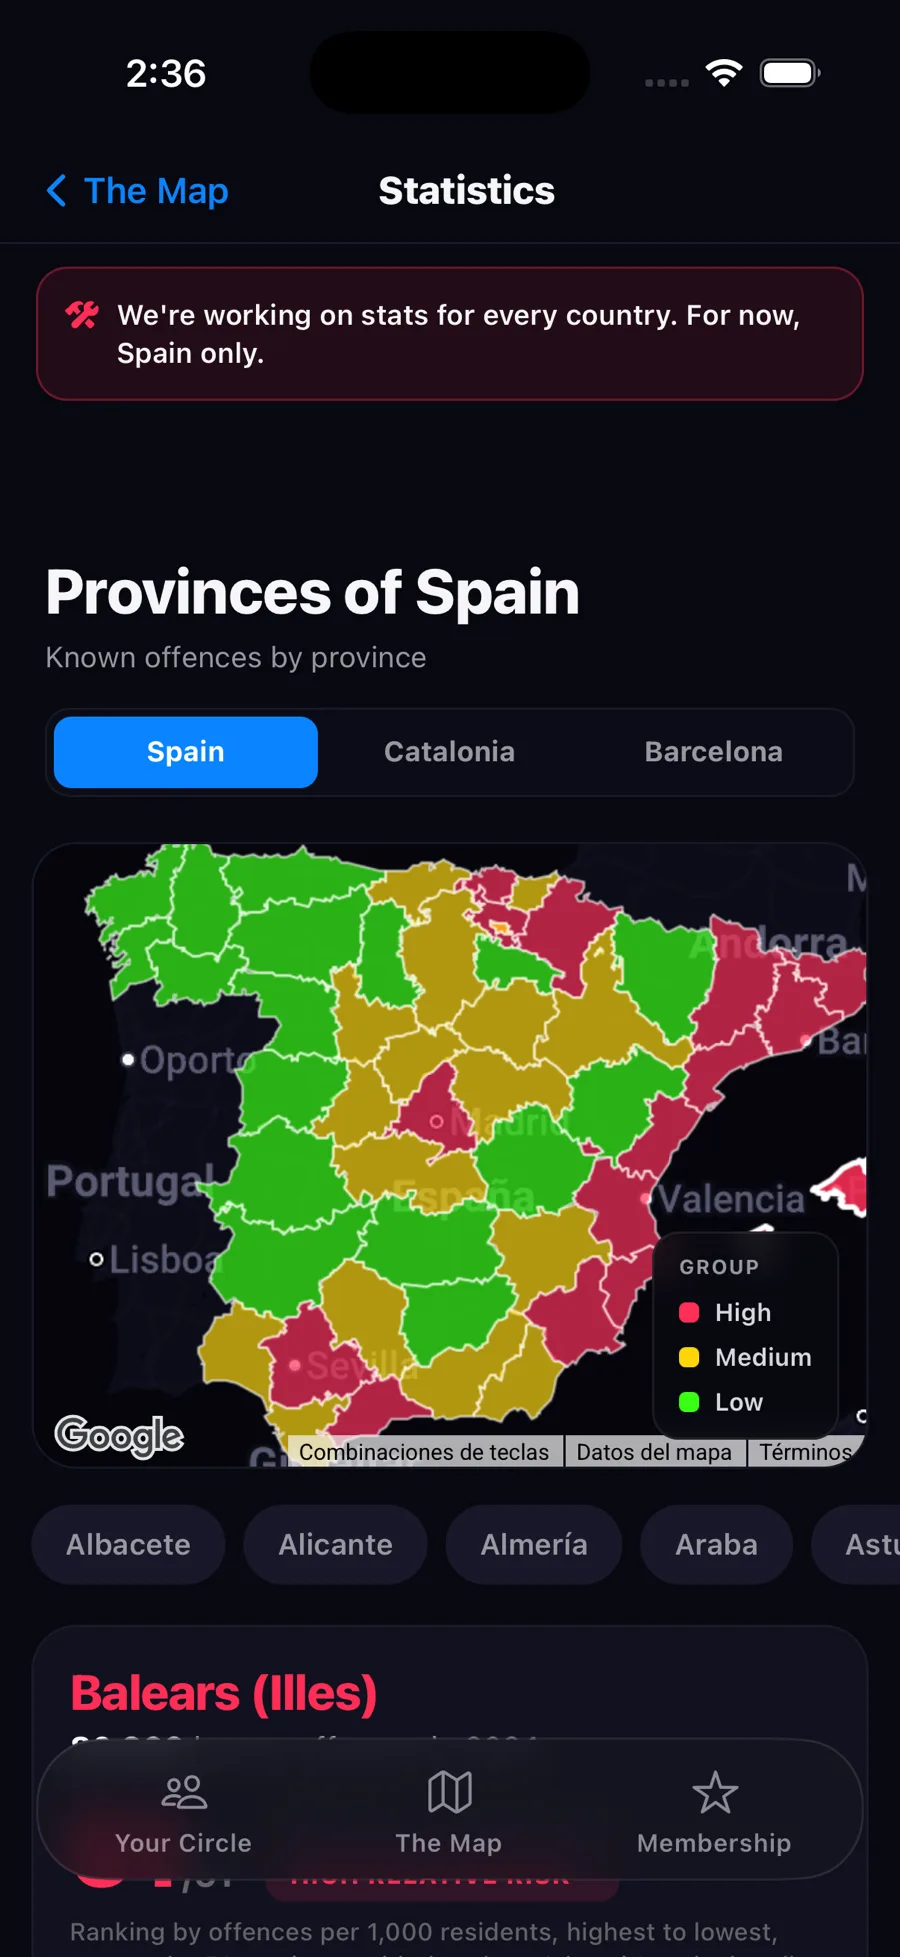
From the whole country to your district.
Three tabs, three maps. The colour means the same thing in all three: Barcelona isn't compared to itself, it's compared to all of Catalonia.
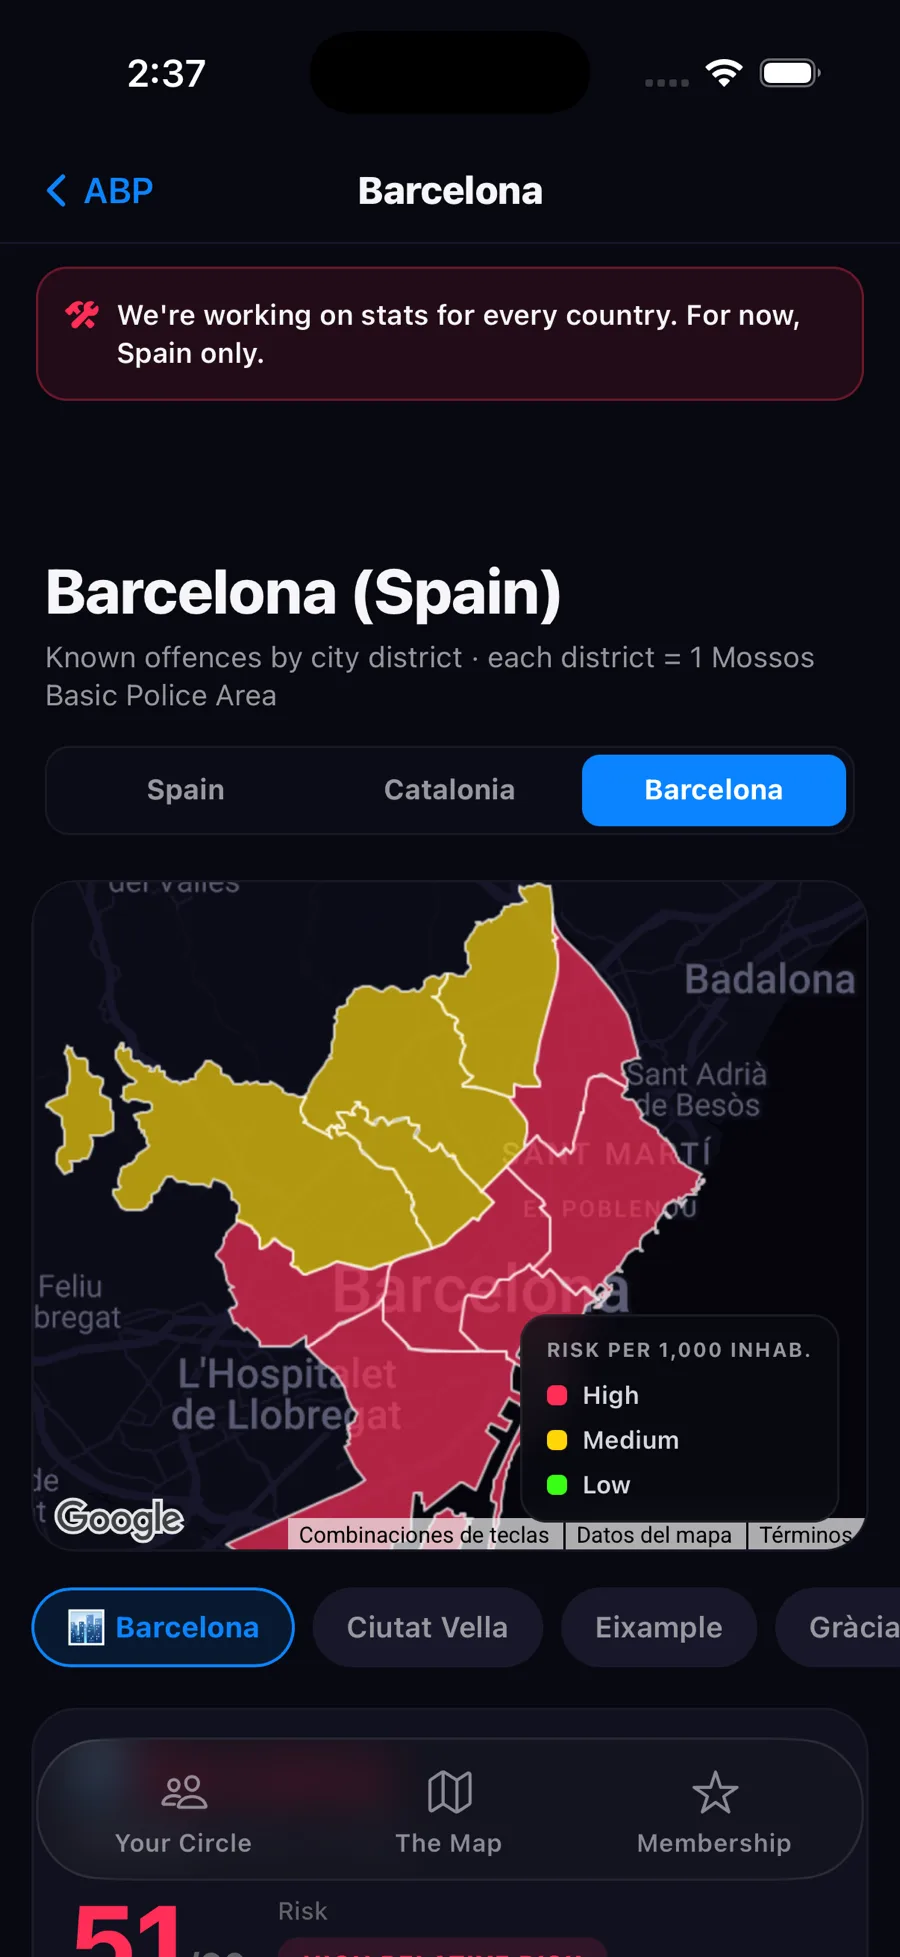
"High risk" doesn't mean what it sounds like.
It's relative. It's your area's position against the rest, not the odds of something happening to you.
There's always a third in red. By definition.
High
The third of areas with the most offences per 1,000 residents.
Medium
The middle third.
Low
The third of areas with the fewest offences per 1,000 residents.
The ranking (51/51) is the position when all areas are sorted by offences per 1,000 residents, highest to lowest. The percentage (+2%) compares the last closed year with the previous one, not adjusted for population. It's also explained inside the app.
Only what happens on the street.
We don't add up the whole penal code. Just what affects walking down the street.
And using the official categories as-is, no eyeballed grouping.
This isn't neighbour reports.
This is official data, closed by year. It never mixes with what people report.
One tells you what your area is like. The other tells you what's happening right now.
All 51 provinces, one by one.
Street crime per 1,000 residents in 2024. Find yours.
Source: Statistical Crime Portal of the Ministry of the Interior (recorded offences, 2024) and population from INE. For Catalonia and Barcelona, open data from the Mossos d'Esquadra published by the Generalitat.
Know they got there safe.
Live location sharing just your area, arrival and departure alerts, "I'm okay" in one tap, and chat.
See how the circle works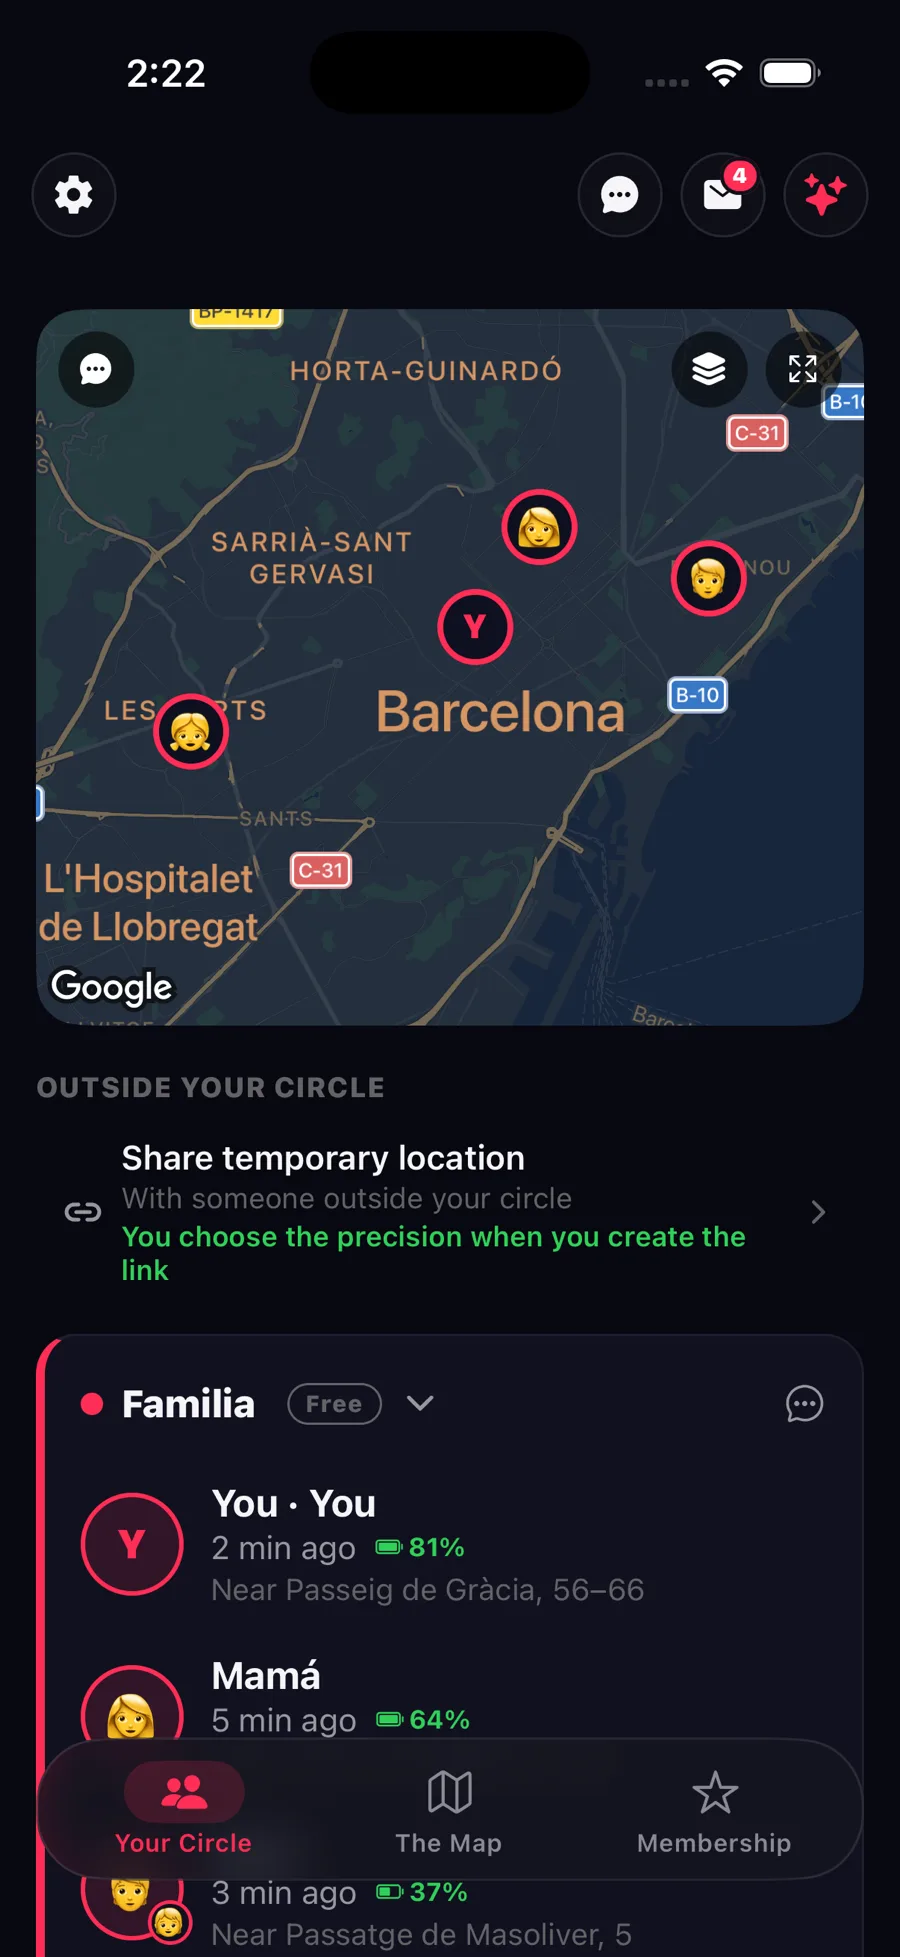
See how your area looks.
It's all inside the app. No sign-up, no payment.